Use UpInsight today from a browser, tablet or phone. We can also install it on your environment.
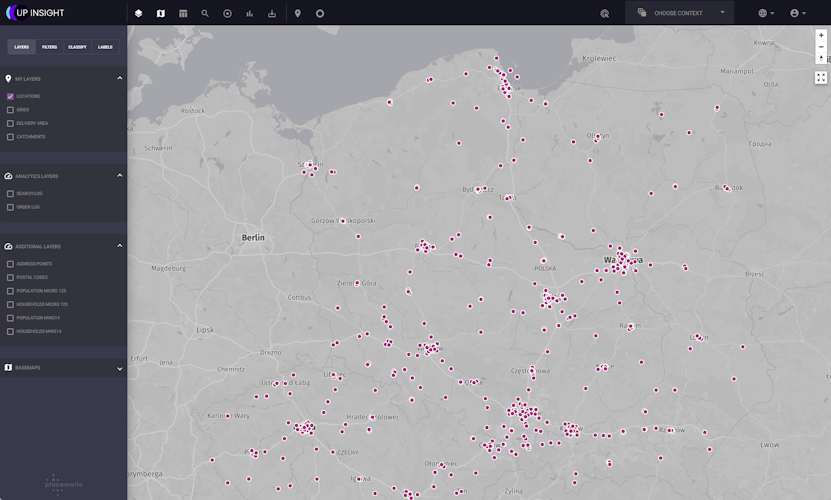
Transfer data to the map
Over 80% of processed data has a spatial reference, but you will not see it in tables or charts.
Locations
Display your branches or customer locations on the map based on your address details.
Areas
Generate areas of delivery, delivery, distribution, and impact of your company.
Additional data sets
Prepared collections of demographic data, competition, POI and many others will show what your business environment looks like.
Analyze
Use UpInsight to process your data from different angles. Use additional layers to enrich your analysis.
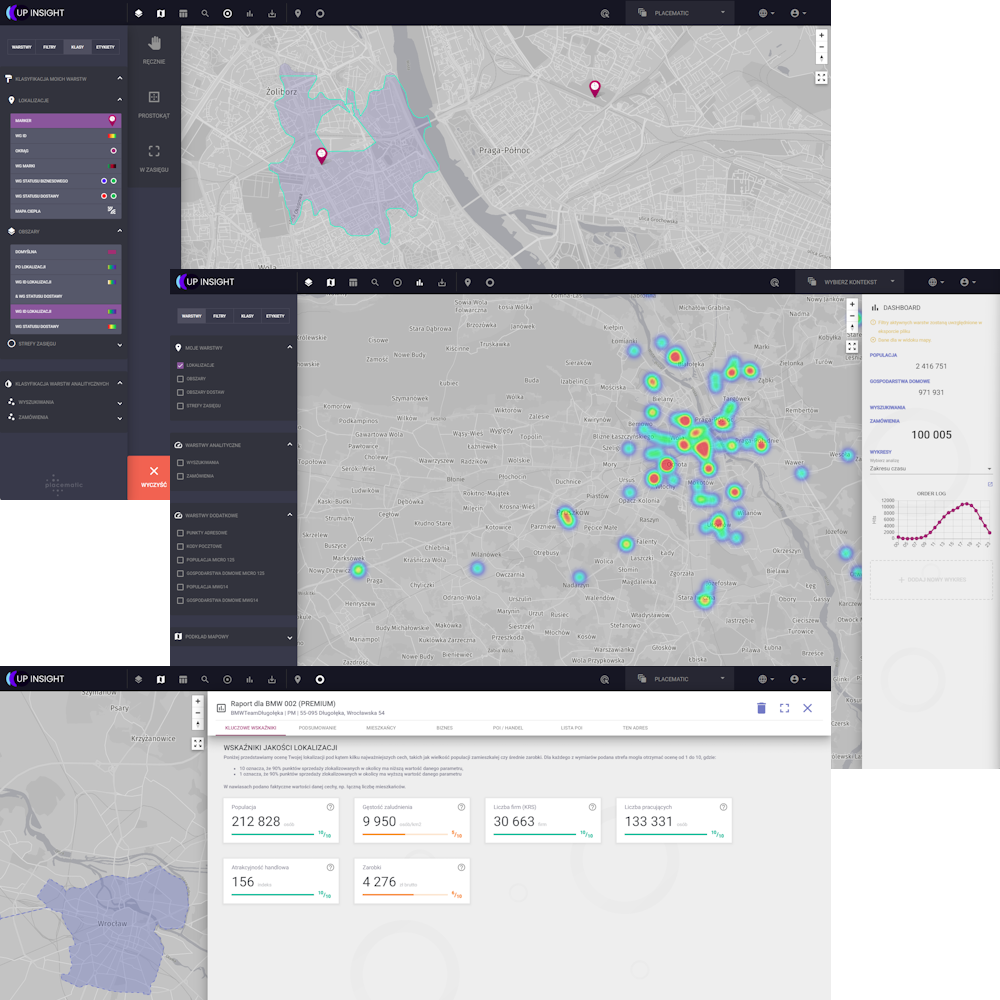
Location assessment
Plan the location of new investments or optimize the existing network. Create impact zones for a given point and generate a report based on a number of data and factors.
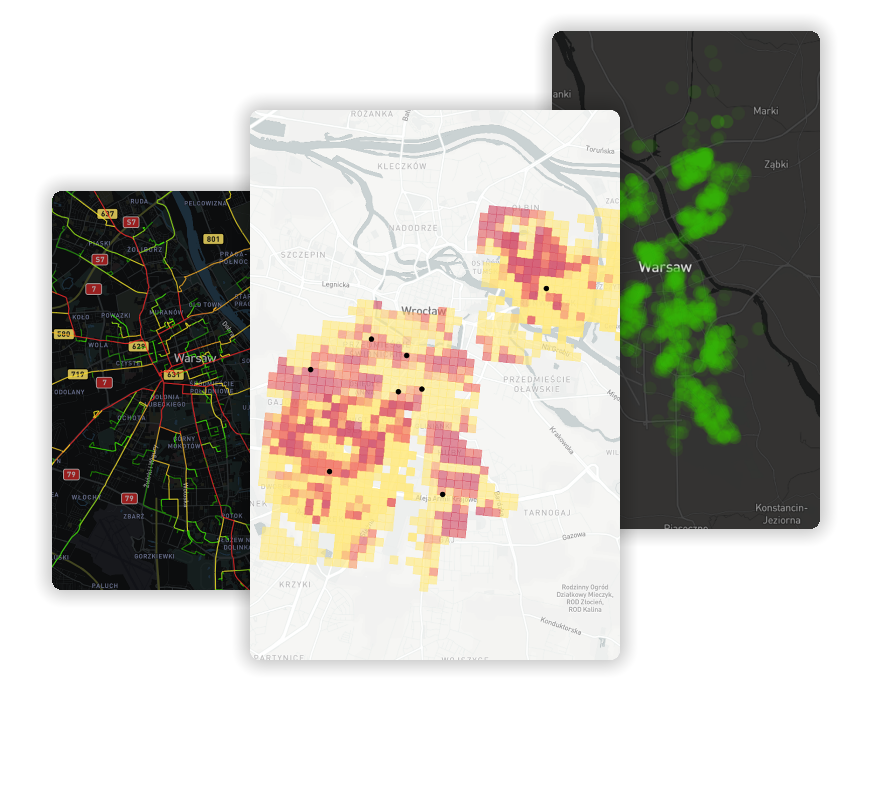
Event analysis
Collect historical events relevant to your business in the form of points on the map, e.g. orders, and then present them using a heat map.
Data visualization
Advanced data visualization options, classification, filtering will create clear and attractive maps that will help you reach customers or business partners more easily
Application in many industries
Our solutions have various applications in many industries. If you do not know how to use your data, please contact us and we will definitely find a solution.
Expansion
Assessing the location of branches in terms of market environment, preparing reports on individual branches and comparing them with each other.
Sale
Presentation of sales and turnover data from enterprise resource planning (ERP) and business intelligence (BI) systems.
Marketing
Optimization of distribution areas, determining marketing areas.
We develop our products based on the latest technologies that guarantee efficient and safe management of your data
Security
Authentication and encryption will make your data secure. If the security policy requires installation of the application on your environment – we will do it!
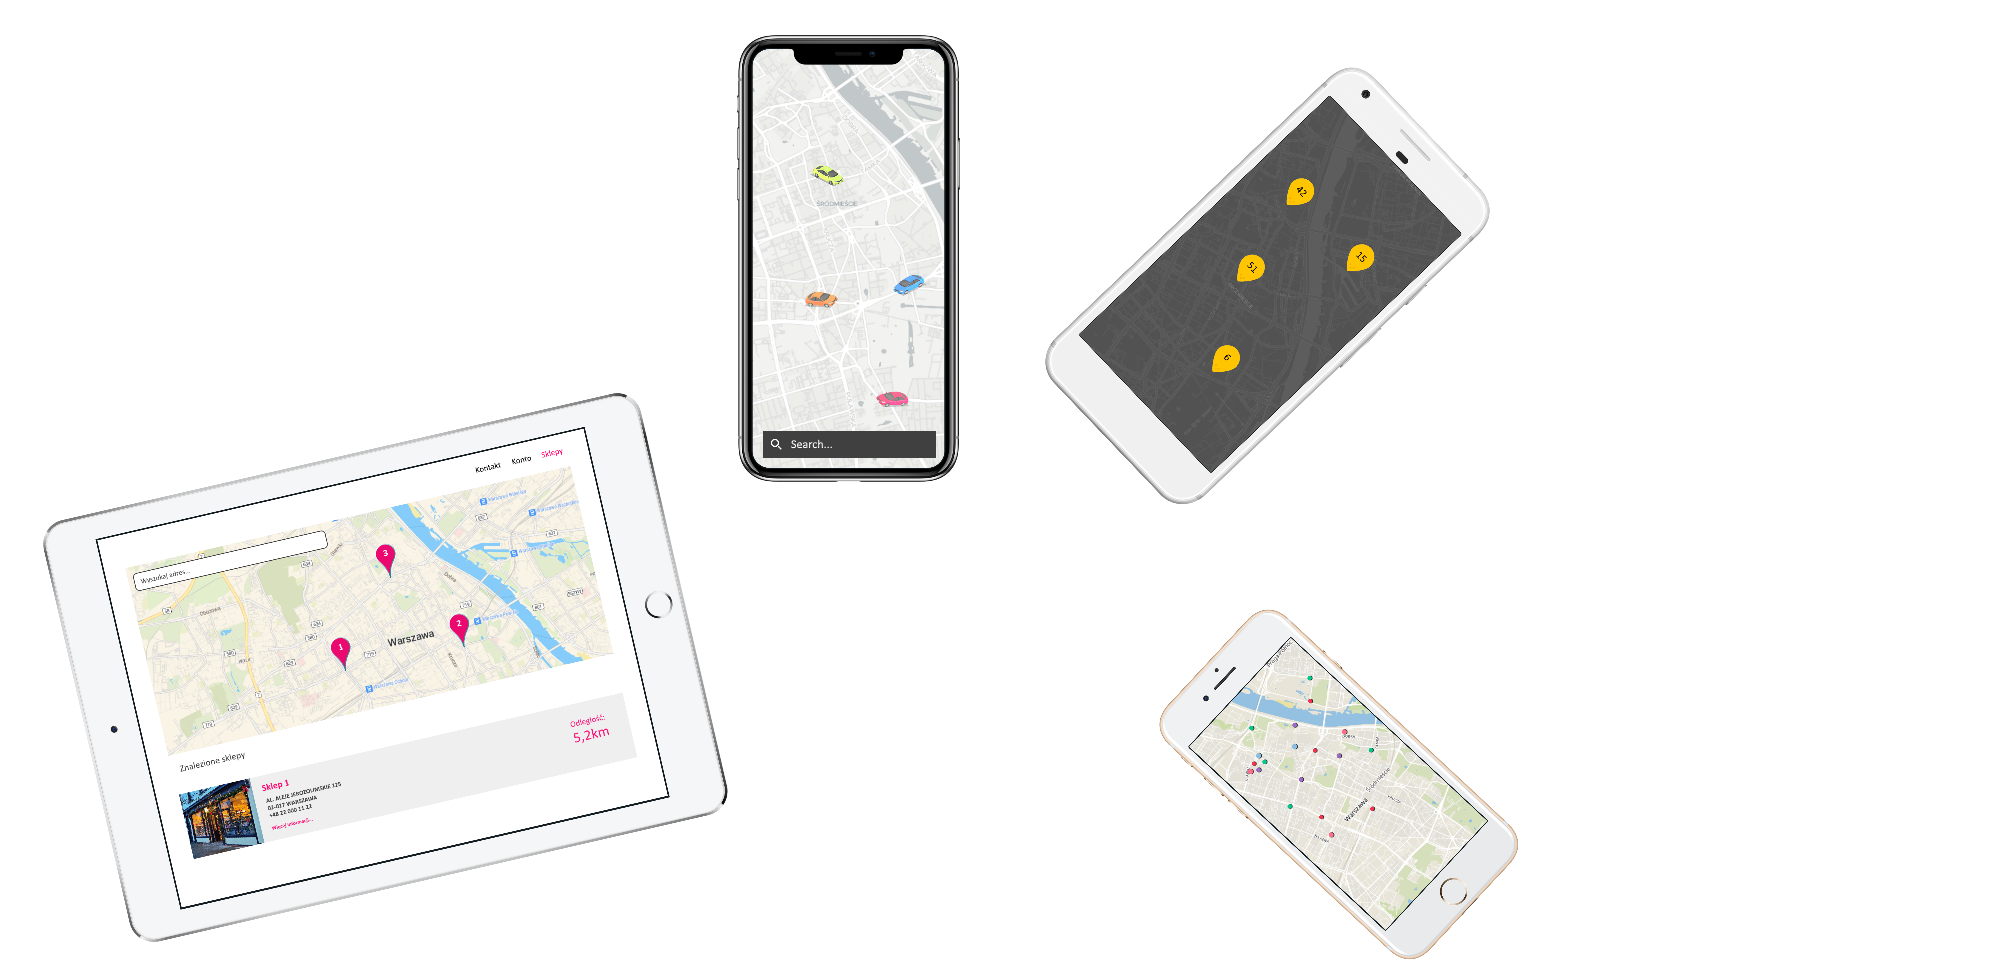
Responsiveness
Our application automatically adapts to the device you are using. It is also fully compatible with touch devices